

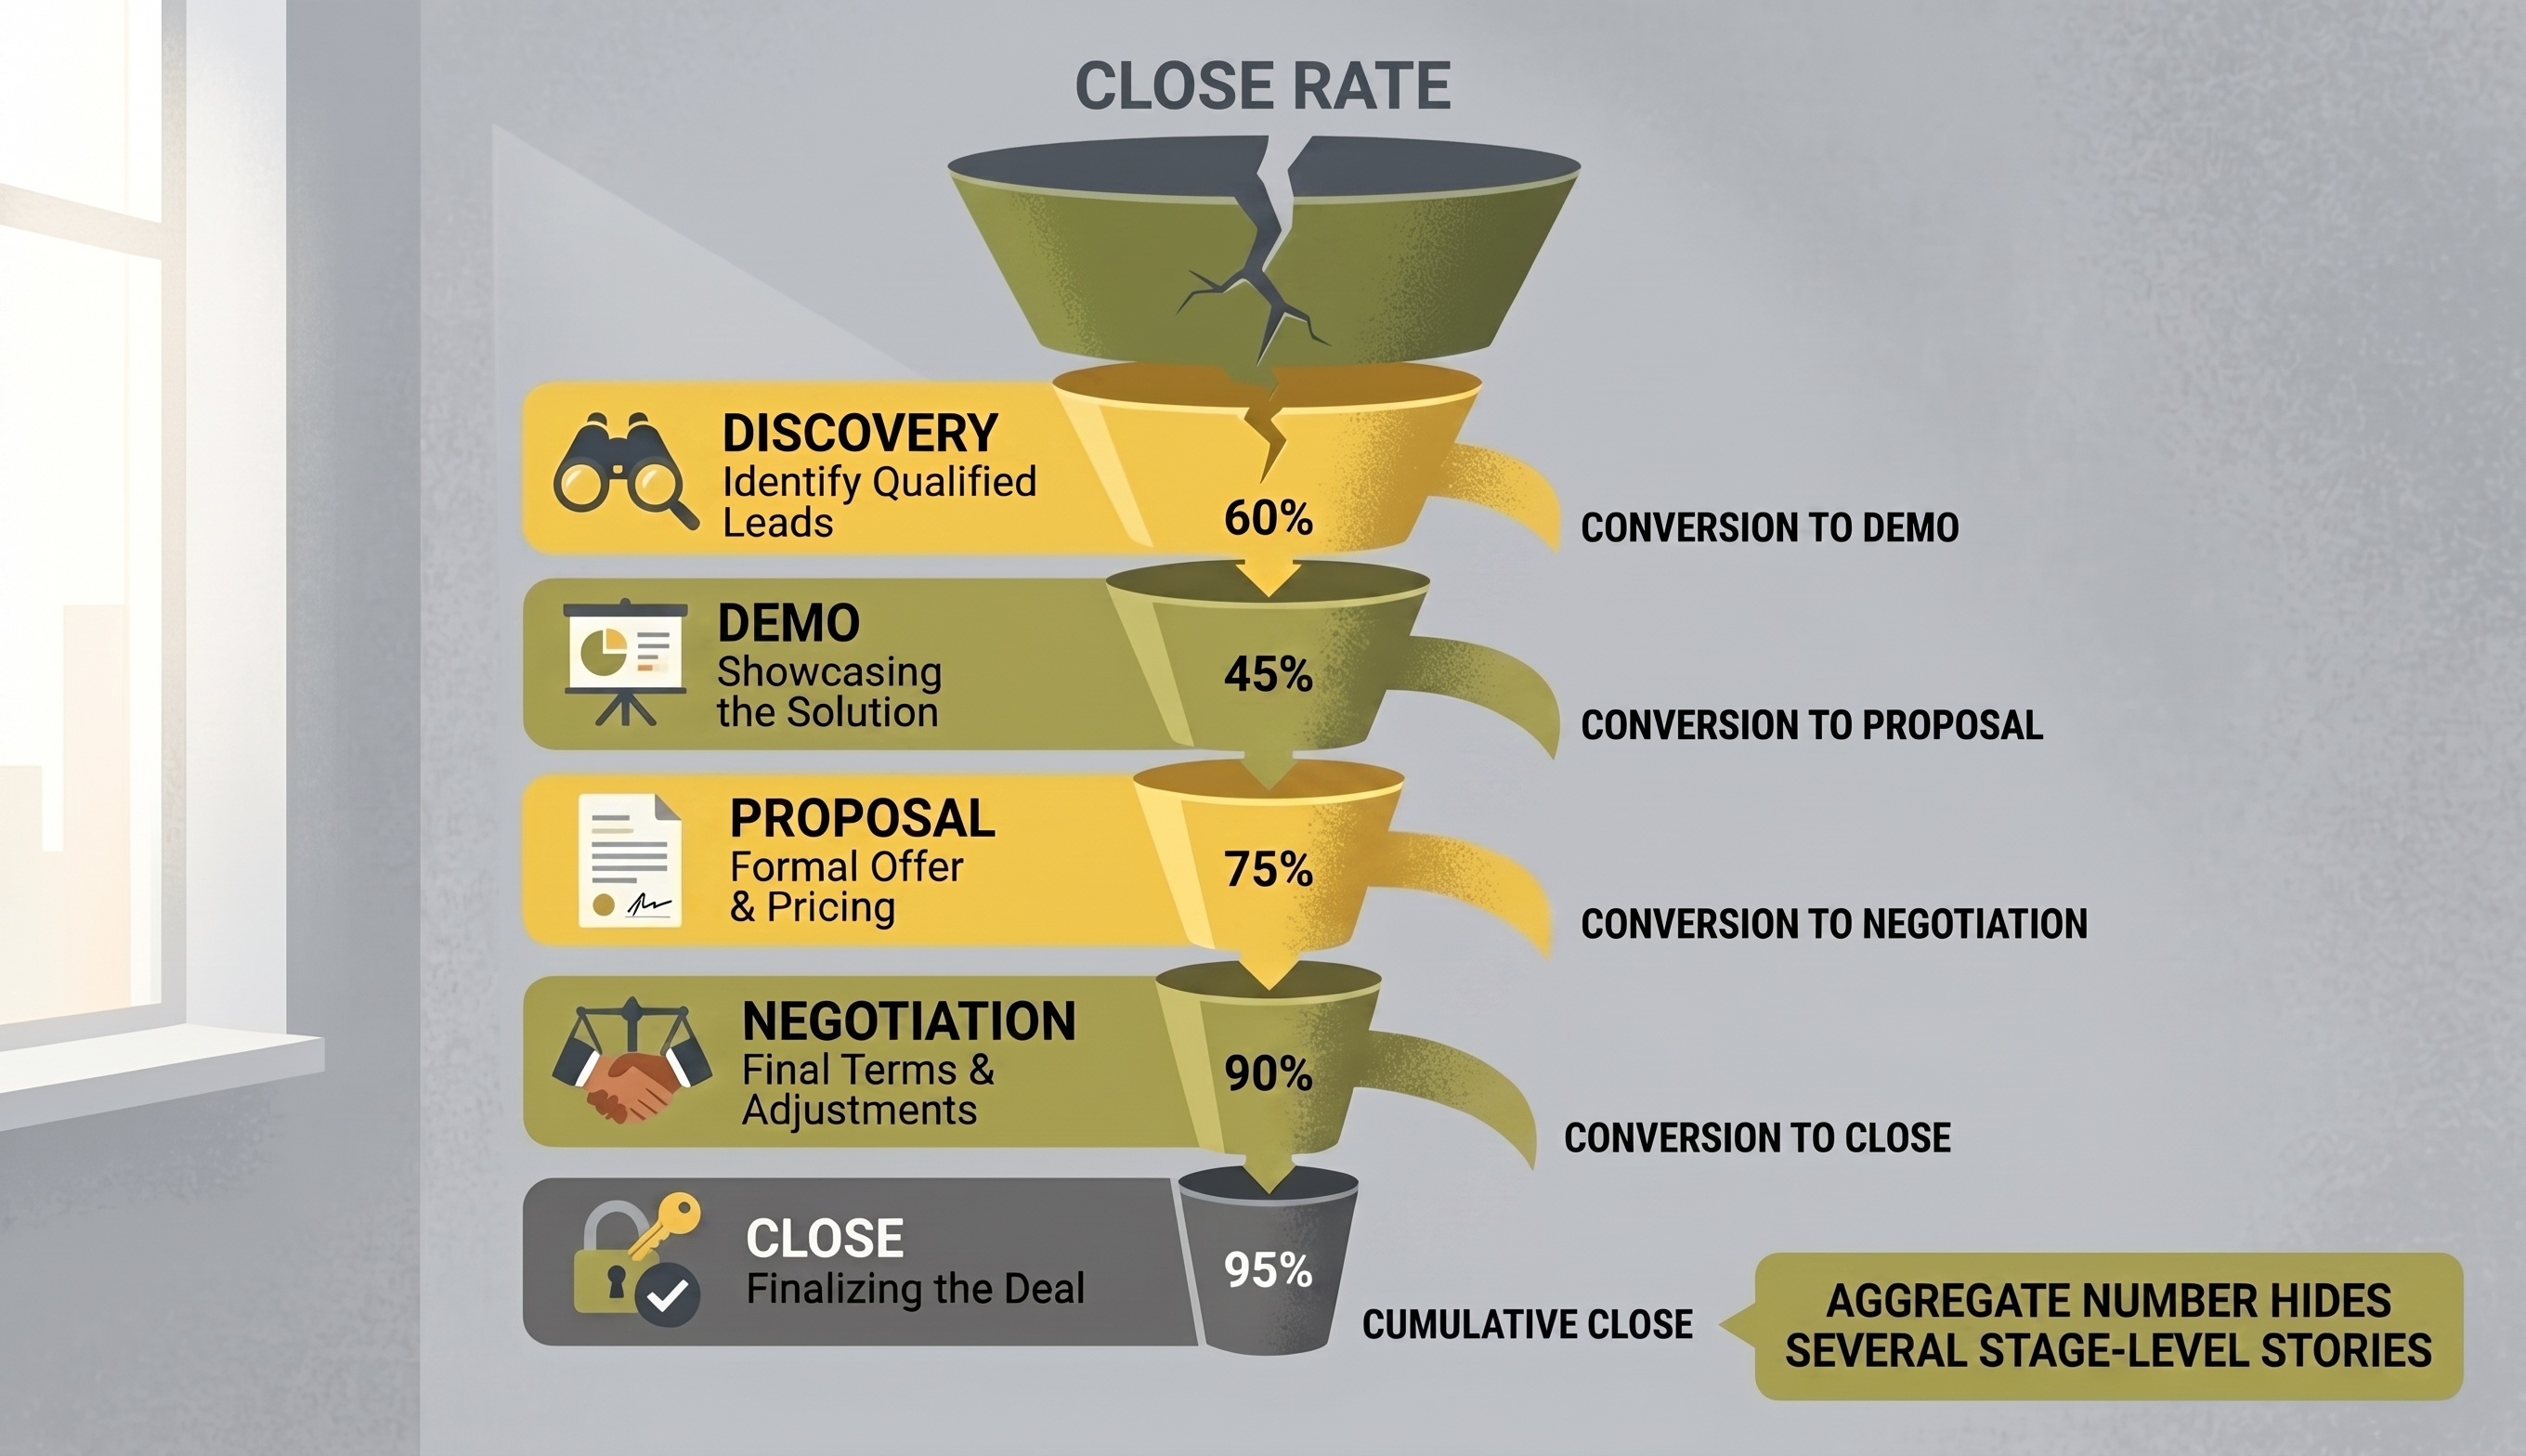
Short answer: Your close rate can look low even when your leads are genuinely good, because close rate is a single, averaged number sitting on top of a process with five or six different stages, each with its own failure points. A discovery call that never confirms budget, a proposal that lands two weeks after the buyer already lost momentum, a champion who never brought in the economic buyer: all of that gets compressed into one percentage. The number tells you something broke. It doesn't tell you what.
If you've pulled up your CRM dashboard, seen a close rate that looks worse than it should given the quality of the leads coming in, and felt a flicker of "something is wrong here, I just can't tell what," that instinct is correct, and it's also exactly where most founder-led sales processes get stuck. The dashboard shows you the outcome. It was never built to show you the cause.
This is a familiar shape if you've read the rest of this series. A marketing agency takes the blame for a system problem it didn't create. A growth engine stalls the moment the one person who understood it walks out the door. A flywheel never gets credit for its own momentum because every setback gets read as proof the whole approach failed. Close rate has its own version of this pattern: it's the number leaders stare at hardest, and the number least capable of telling them what to actually fix.
Why close rate is the wrong diagnostic tool
Close rate answers one question: out of the opportunities that entered your pipeline, how many became customers? That's a useful scoreboard number. It's a poor diagnostic tool, because it treats every lost deal as functionally identical, whether it died in the first call because of a bad fit, in the middle because nobody confirmed budget, or at the very end because a stakeholder who was never looped in vetoed the deal at the last minute.
A close rate of 18 percent and a close rate of 24 percent can both be hiding a real, fixable problem, or both can reflect a genuinely healthy process working as intended. The number alone can't tell you which. It's a lagging indicator: by the time it moves, the deals behind it already happened, weeks or months earlier, and whatever caused the shift is already history by the time it shows up in the aggregate rate.
Where deals actually die: the stages hiding inside your close rate
The fix isn't a better close rate. It's breaking the single number back into the stages that produced it. Stage conversion rates, the percentage of deals that move from one stage to the next, expose exactly where a pipeline loses deals, because each stage is really answering a different question for the buyer: do we have a real problem worth solving, do we trust this vendor to solve it, does the proposal match what we actually need, and can we get internal agreement to move forward.
Typical B2B benchmarks put discovery-to-demo conversion in the 40 to 50 percent range and late-stage negotiation conversion closer to 20 to 30 percent, according to pipeline research from B2B intelligence firm Salesmotion, which notes that "stage conversion rates expose where deals die" in a way that an aggregate close rate simply cannot. Those aren't targets to hit. They're a reference point for noticing which of your own stages is underperforming its peers, which is where the actual answer to a low close rate usually lives.
A few patterns show up often enough to be worth checking first:
-
Strong early conversion, weak late conversion. Deals move easily into your pipeline but stall or die near the finish line. Usually a sign that value isn't compelling enough once real budget and internal politics enter the picture, or that pricing surprises someone late.
-
Weak early conversion, stronger late conversion. Reps close well once a deal is genuinely qualified, but too few deals get that far. Usually a lead-quality or messaging problem sitting upstream of the sales team entirely.
-
Flat conversion across every stage. No single stage stands out as the leak. Usually means stage definitions are vague, or deals are being advanced in the CRM inconsistently, which makes the whole pipeline harder to trust.
Each of these produces a similarly unimpressive close rate. Each one needs a completely different fix.

A high close rate on a small pipeline still isn't a system
It's worth saying the reverse plainly, because it trips up just as many founder-led businesses: a high close rate isn't automatically good news either. If your team wins 60 percent of a five-deal pipeline, that's not evidence of a strong sales process. It's evidence of a small, cautious pipeline where reps are only pursuing the safest, most obviously qualified opportunities, which can quietly starve the business of volume while the dashboard looks great.
A close rate only means something in the context of the opportunity count and deal quality that produced it. A 20 percent close rate on 100 well-qualified opportunities usually reflects a healthier, more scalable sales motion than a 60 percent close rate on eight. One is a system that can grow. The other is a number that happens to look good this quarter.
What actually changes the outcome
Marketing Monsoon watched this play out directly with a solar client whose team came in convinced the problem was their closers. The close rate looked flat quarter over quarter, and the instinct was to coach harder on the close. The actual issue, once the pipeline was broken into stages, was upstream: qualified leads were arriving without a clear enough picture of financing options, so deals were stalling in the middle of the process rather than dying at the end. Once that specific stage got fixed, financing conversations moved earlier and became more concrete, close rate increased fivefold, and the business grew from $500,000 to $1 million in revenue within nine months. Nobody trained the sales team to "close better." The team fixed the stage that was actually broken.
That's the pattern worth internalizing: the fix that moves close rate almost never looks like sales training aimed at the close itself. It looks like finding the specific stage where deals are stalling and rebuilding what happens there.
How to find your own stage-level answer this week
You don't need a new CRM or a data science team to run this. Though we always recommend HubSpot! A useful version of this audit can happen in a few hours with the deal data you already have:
1. Pull your last 20 to 30 closed opportunities (won and lost) and tag each one by the stage it reached before it closed or died. Don't rely on memory. Use the CRM's stage history if you have it.
2. Calculate a conversion rate for each individual stage transition, not just the overall close rate: deals advancing divided by deals that entered that stage.
3. Compare your stage rates against general benchmarks (roughly 40 to 50 percent discovery-to-demo, 20 to 30 percent at negotiation), not as a hard target, but as a flag for anything wildly out of range.
4. Read the deal notes for whichever stage looks weakest, looking specifically for a repeated reason deals stall there: missing stakeholder, unclear pricing, no confirmed budget, slow internal process.
5. Fix that one stage before touching anything else. Resist the urge to overhaul the whole process at once. The stage-level data is telling you exactly where the leverage is.
Why this matters more than it looks like it should
Close rate will always be the number that shows up first in a dashboard, and it will always be the number leadership asks about first in a review. That's fine, as long as it's treated as a symptom worth investigating rather than a verdict on the sales team. A low close rate with good leads coming in almost never means the leads were wrong or the closers are weak. It usually means one specific stage in the process is quietly losing deals that never had to be lost.
The Growth System Map is a free, 10-minute self-assessment built to show you where the leak actually is, whether that's positioning, attraction, conversion, or delivery, before you spend another quarter assuming the problem is your closers.

FAQ
About Marketing Monsoon
Marketing Monsoon, LLC is a growth marketing agency and HubSpot Solutions Partner helping founder-led businesses ($3M-$30M) build the growth infrastructure that aligns marketing, sales, and revenue into one working system. Founded by Jayne Burch, Marketing Monsoon uses its proprietary Growth Engine Diagnostic and the Momentum Hub membership to help CEOs move from scattered tactics to a connected system built for sustainable, compounding growth. Learn more at marketingmonsoon.com.